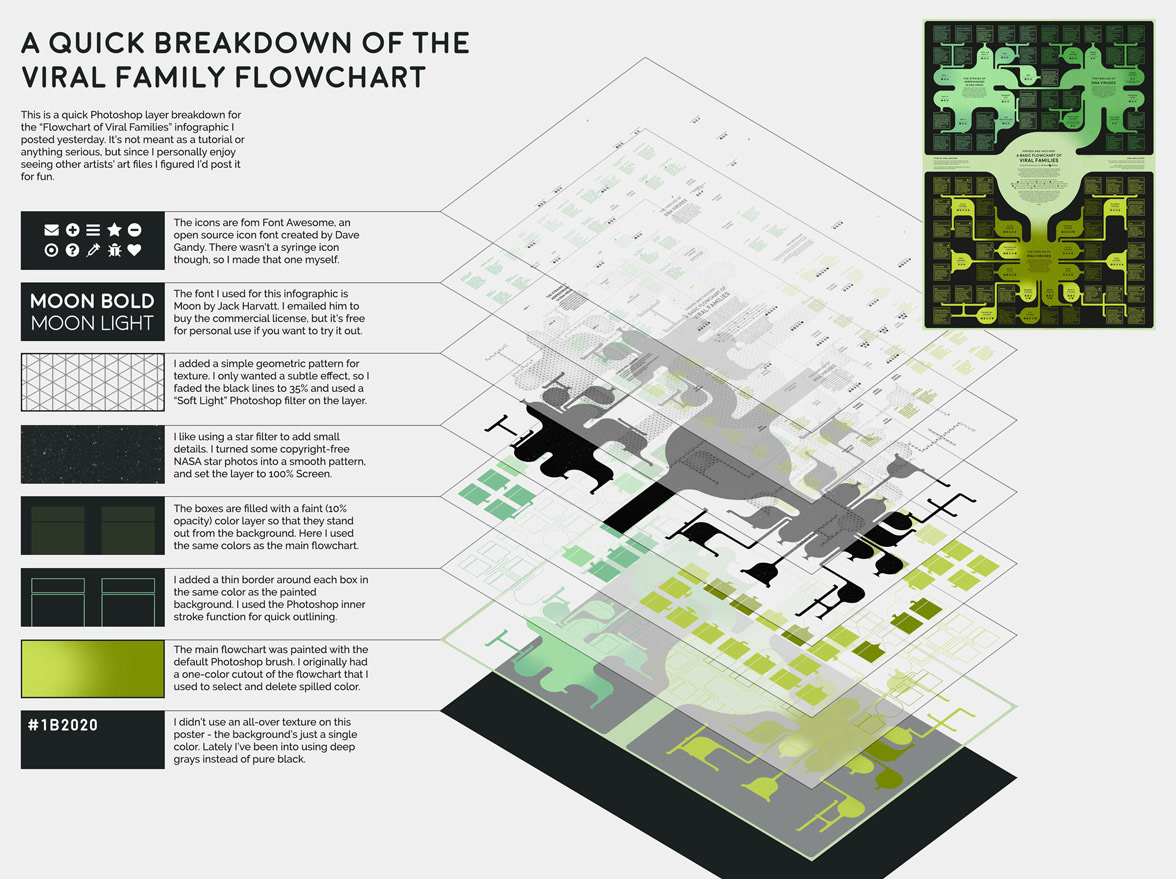
These two flowcharts are part of a larger series of 20 medical infographics designed for Nerdcore Medical.
The first design visualizes common virus species that can infect humans. I used small symbols to categorize several interesting aspects of each virus - whether or not it was transmitted by insects, used DNA vs RNA, or if a vaccine existed for the disease.
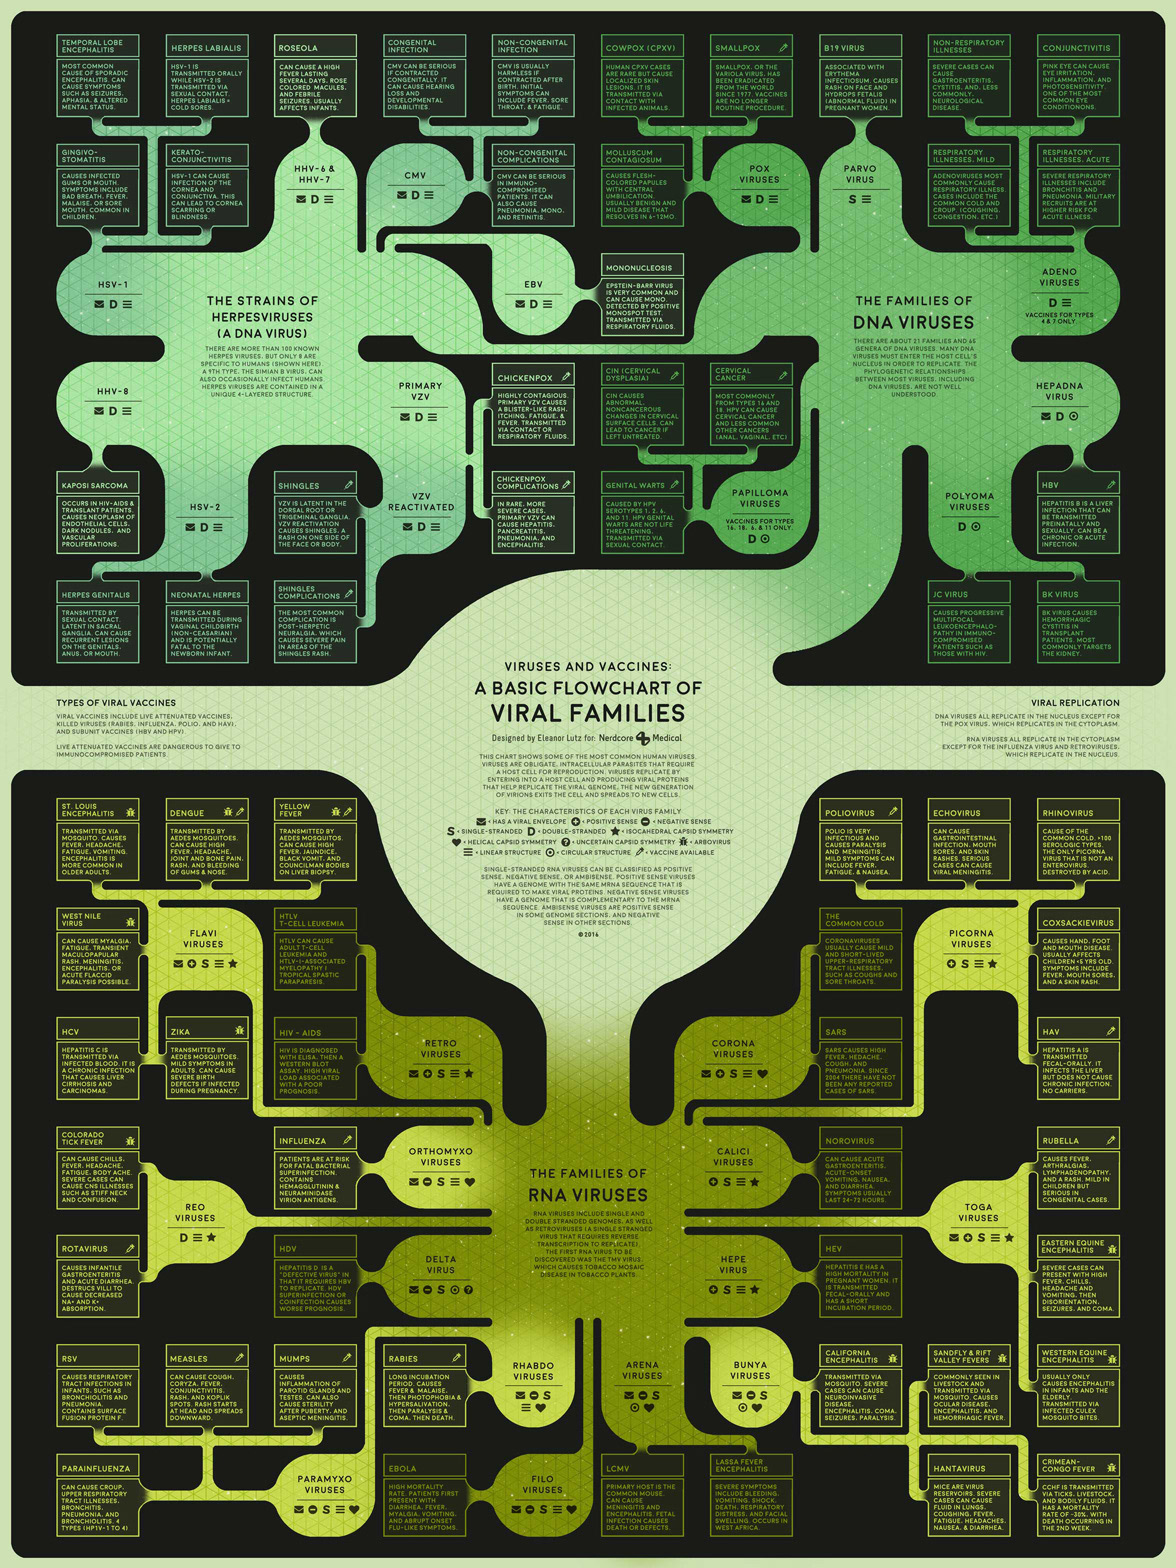
I began designing this flowchart by organizing each of the 60 viruses into three major groups relevant to medical students - the intended audience for the graphic. I next created a grid to outline the position of each virus among those three groups.
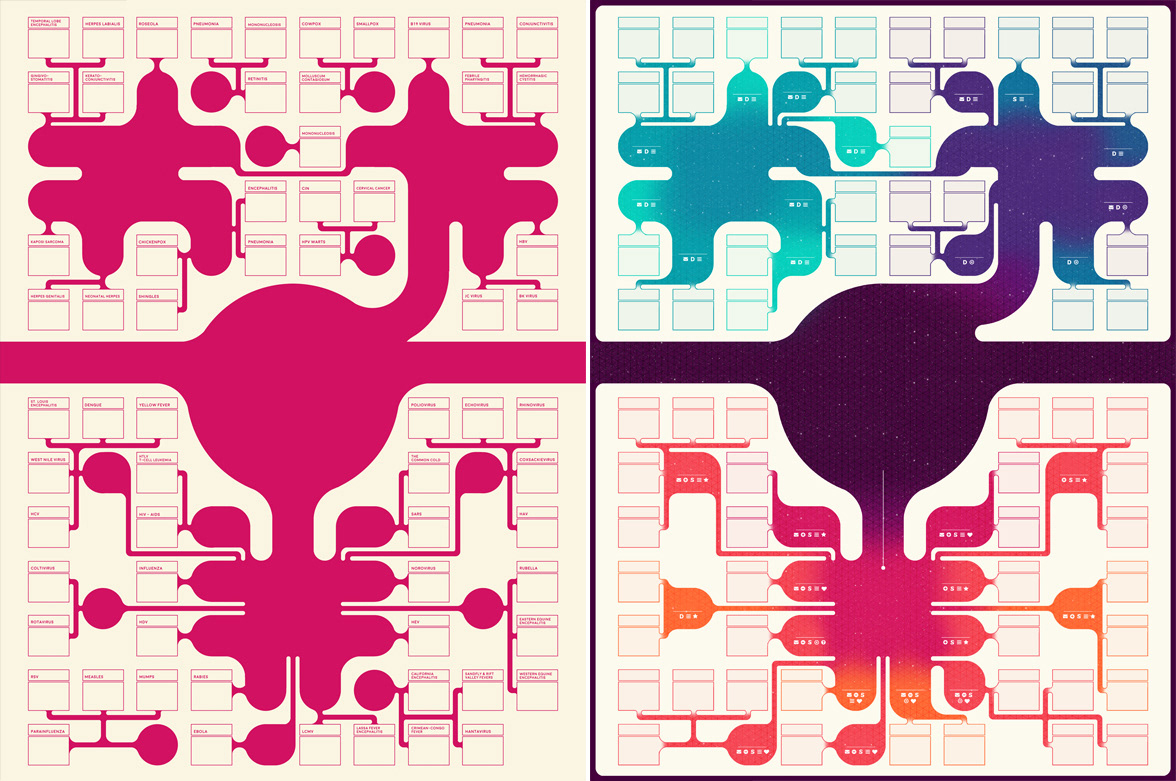
This design style was intended to provide some structure to the dataset, while still acknowledging that each virus was important for medical students to learn. We didn't want to create too much visual hierarchy in the design, because each entry was equally important.
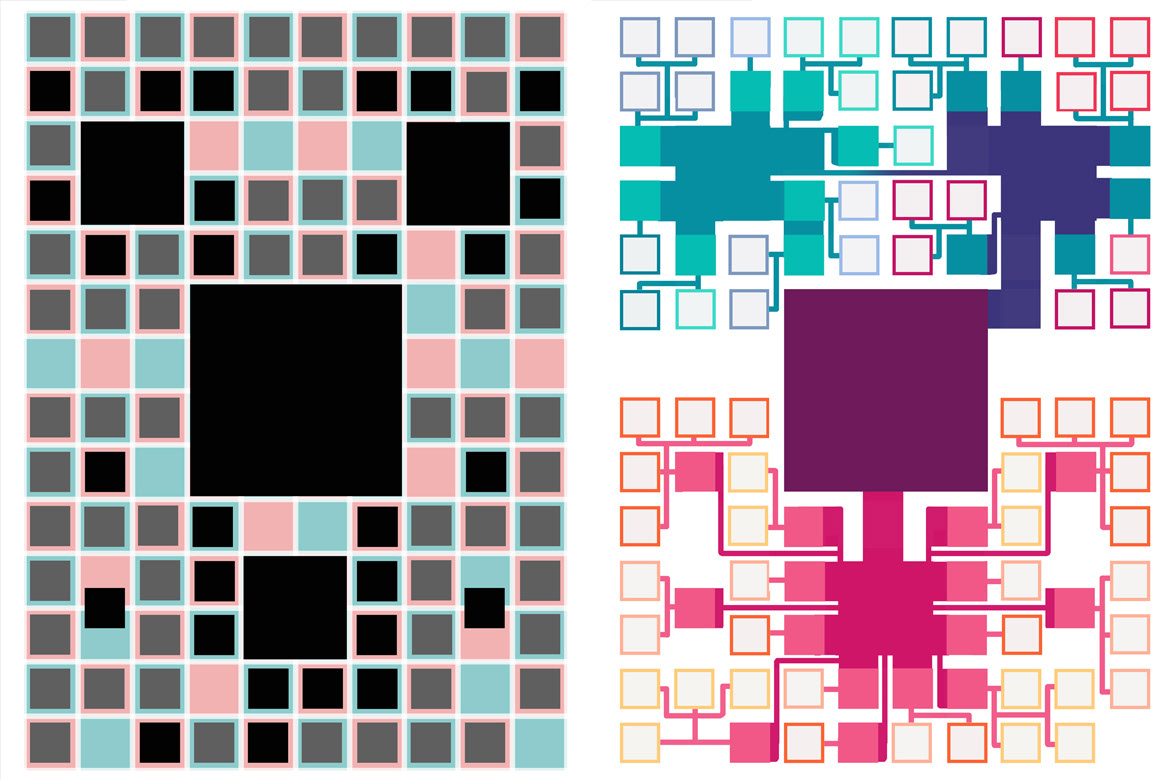
After we established the overall arrangement of viruses, I explored different shapes for the connective "blobs" and added decorative elements like color and texture.
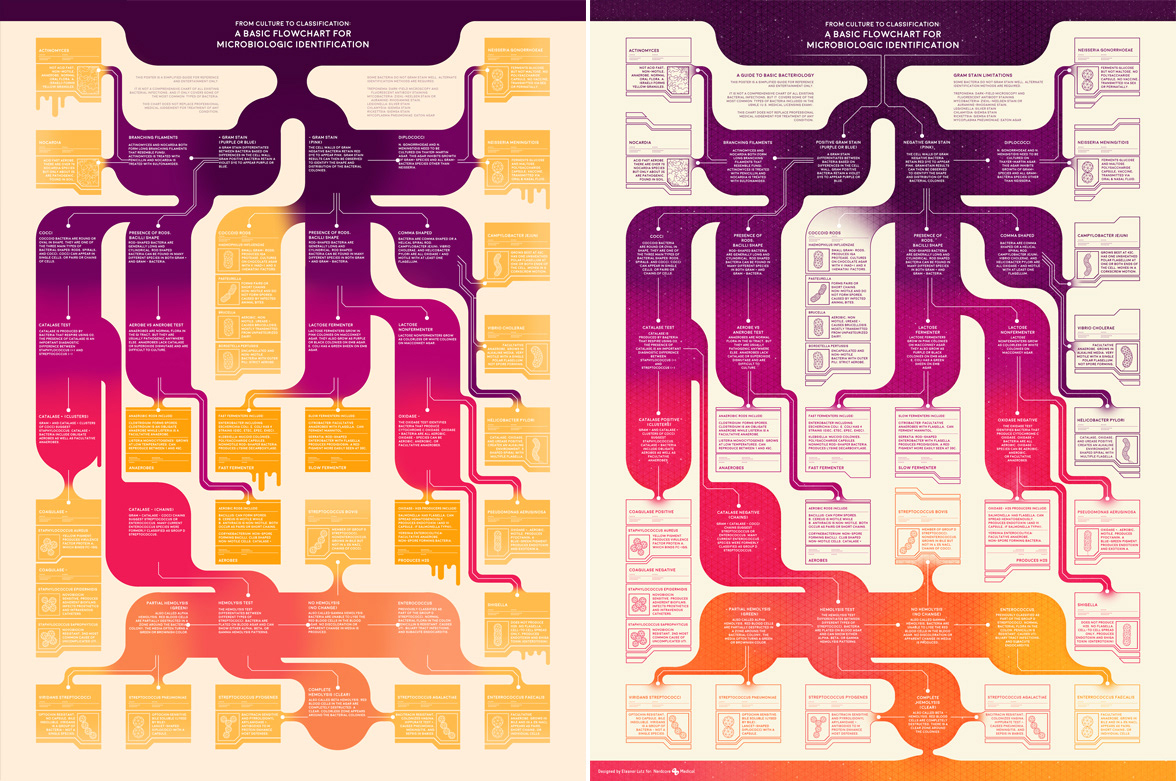
This second graphic explains the process of identifying bacterial infections through laboratory tests. Unlike the virus infographic, this design was intended to have a hierarchical structure. Each test result leads either to an identification result, or continues to further tests flowing "down" the design.
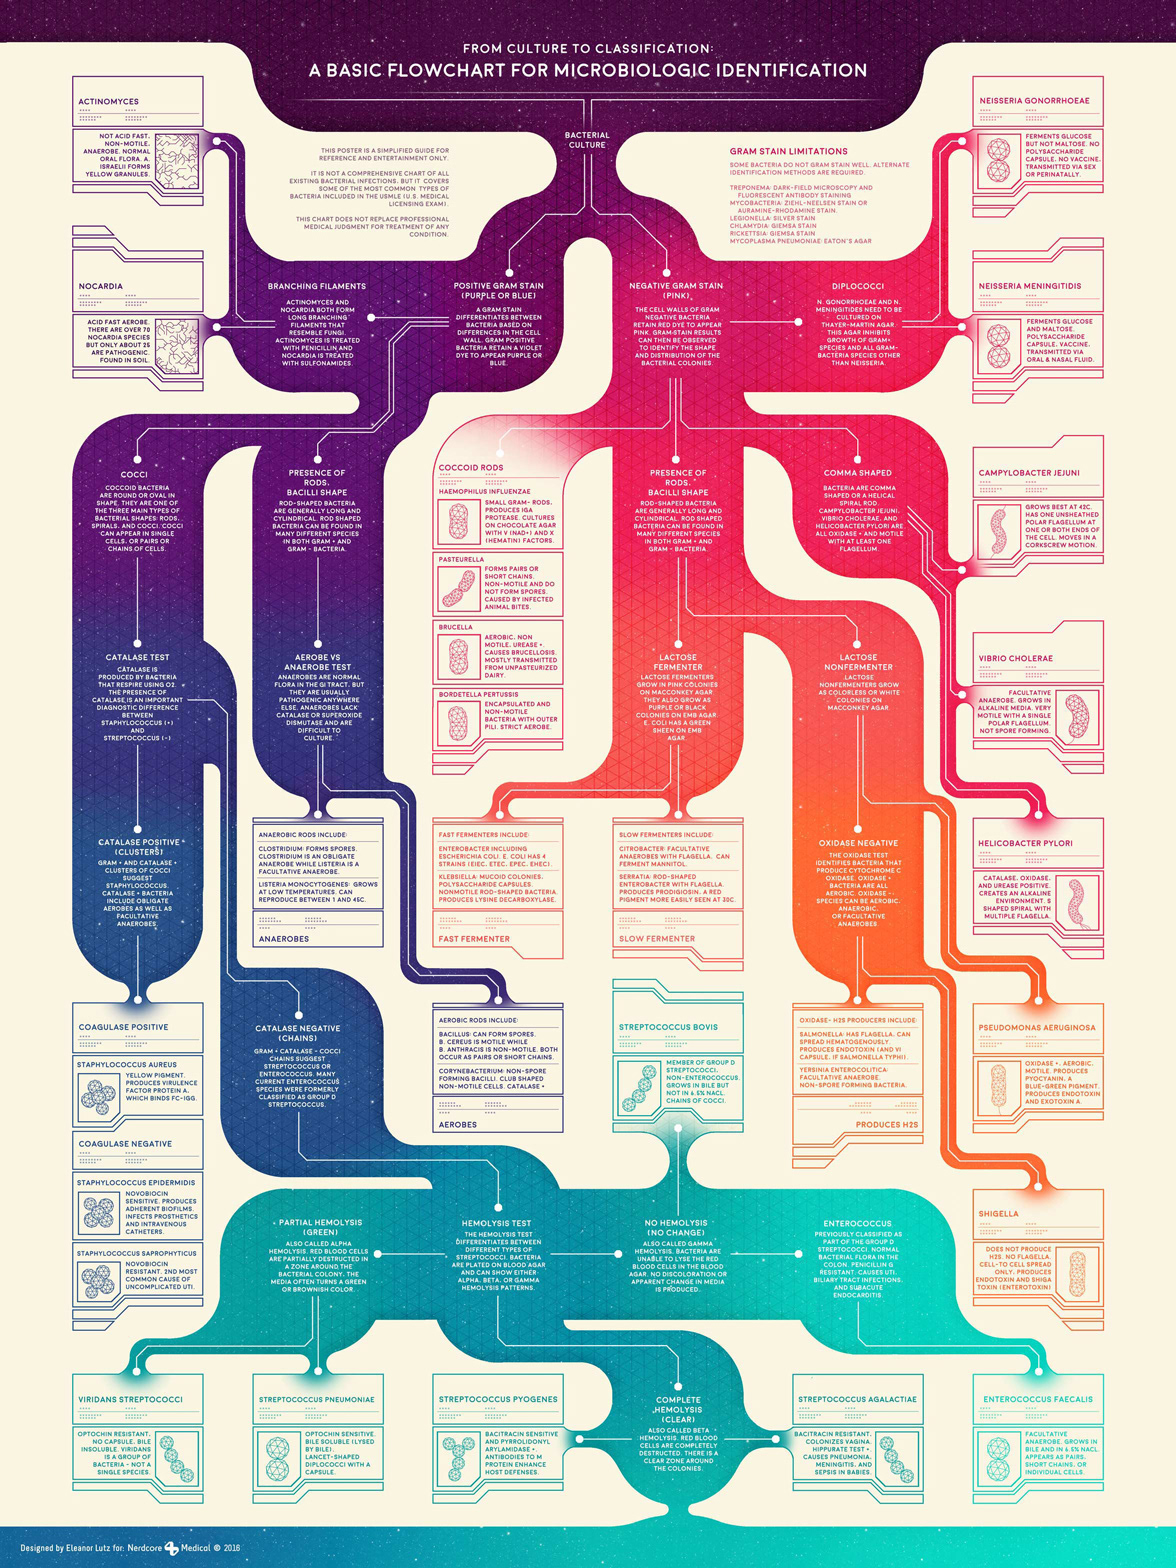
I wanted to emphasize the visual "flow" of information from top to bottom in this graphic. After trying several different color schemes, I decided on a final graphic that de-emphasizes the species identification results and emphasizes the flow of laboratory test sequences.