These are a few of the auto-updating data dashboards I've designed for The New York Times.
Print Covid Dashboard for the Sunday paper
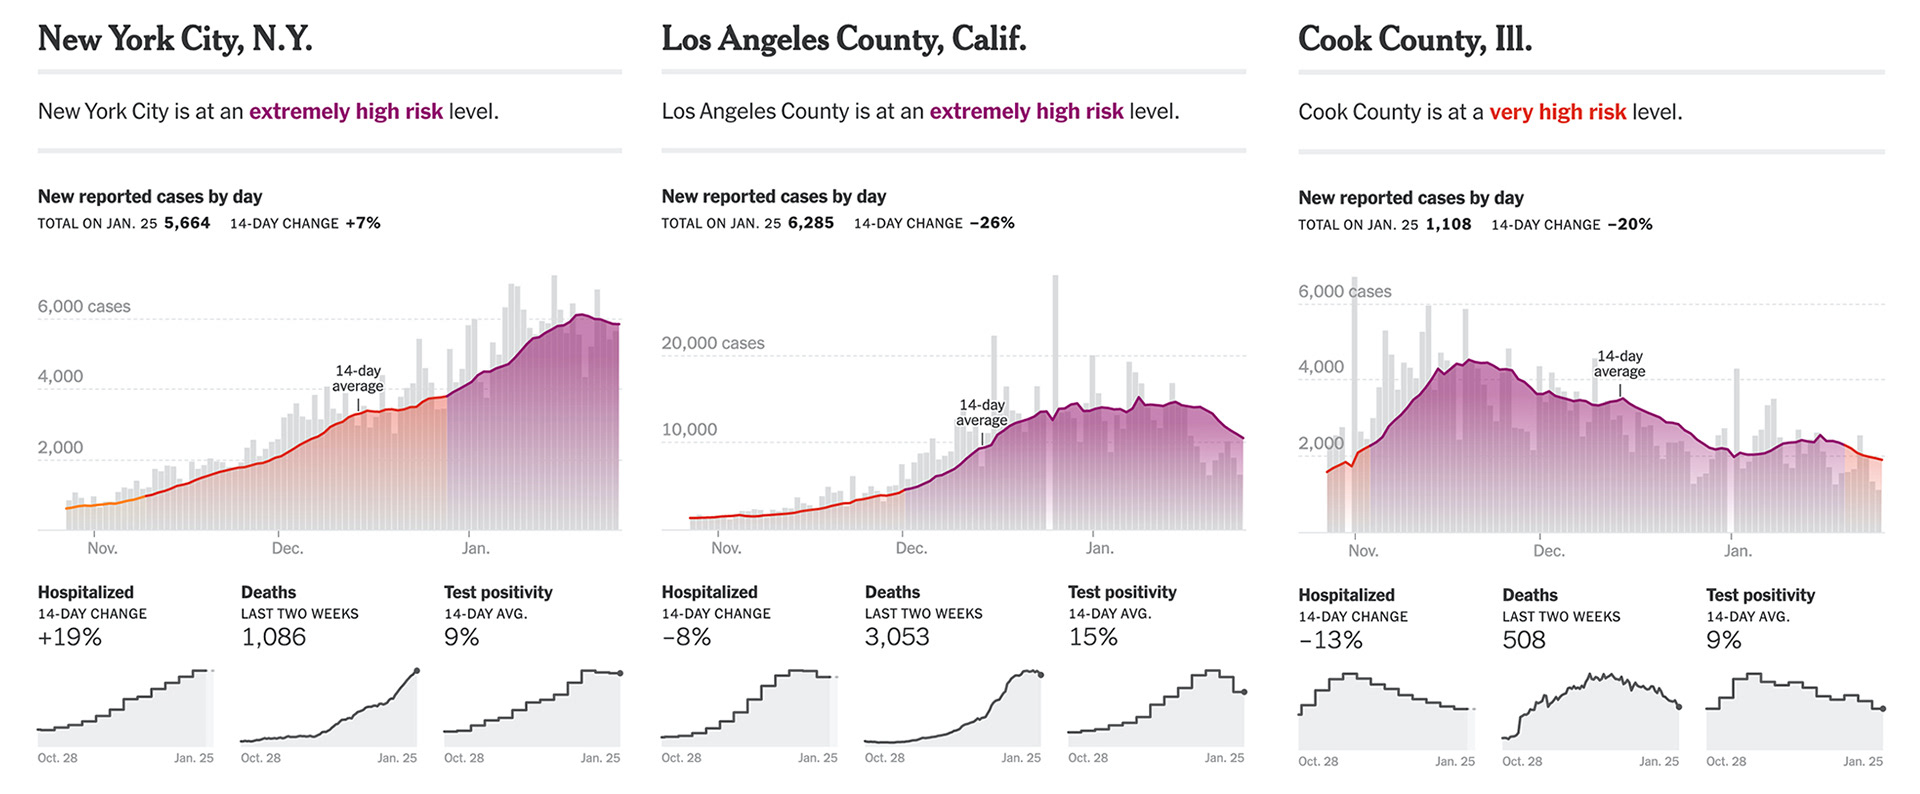
The "Coronavirus Update" section of the Sunday paper shares a snapshot of the Coronavirus pandemic with readers every week. I created a Python script hosted on AWS to produce this graphic each week automatically. The charts are based on internal data updated by the Times. The labels on the map change their color automatically to be legible no matter the color of the map underneath.
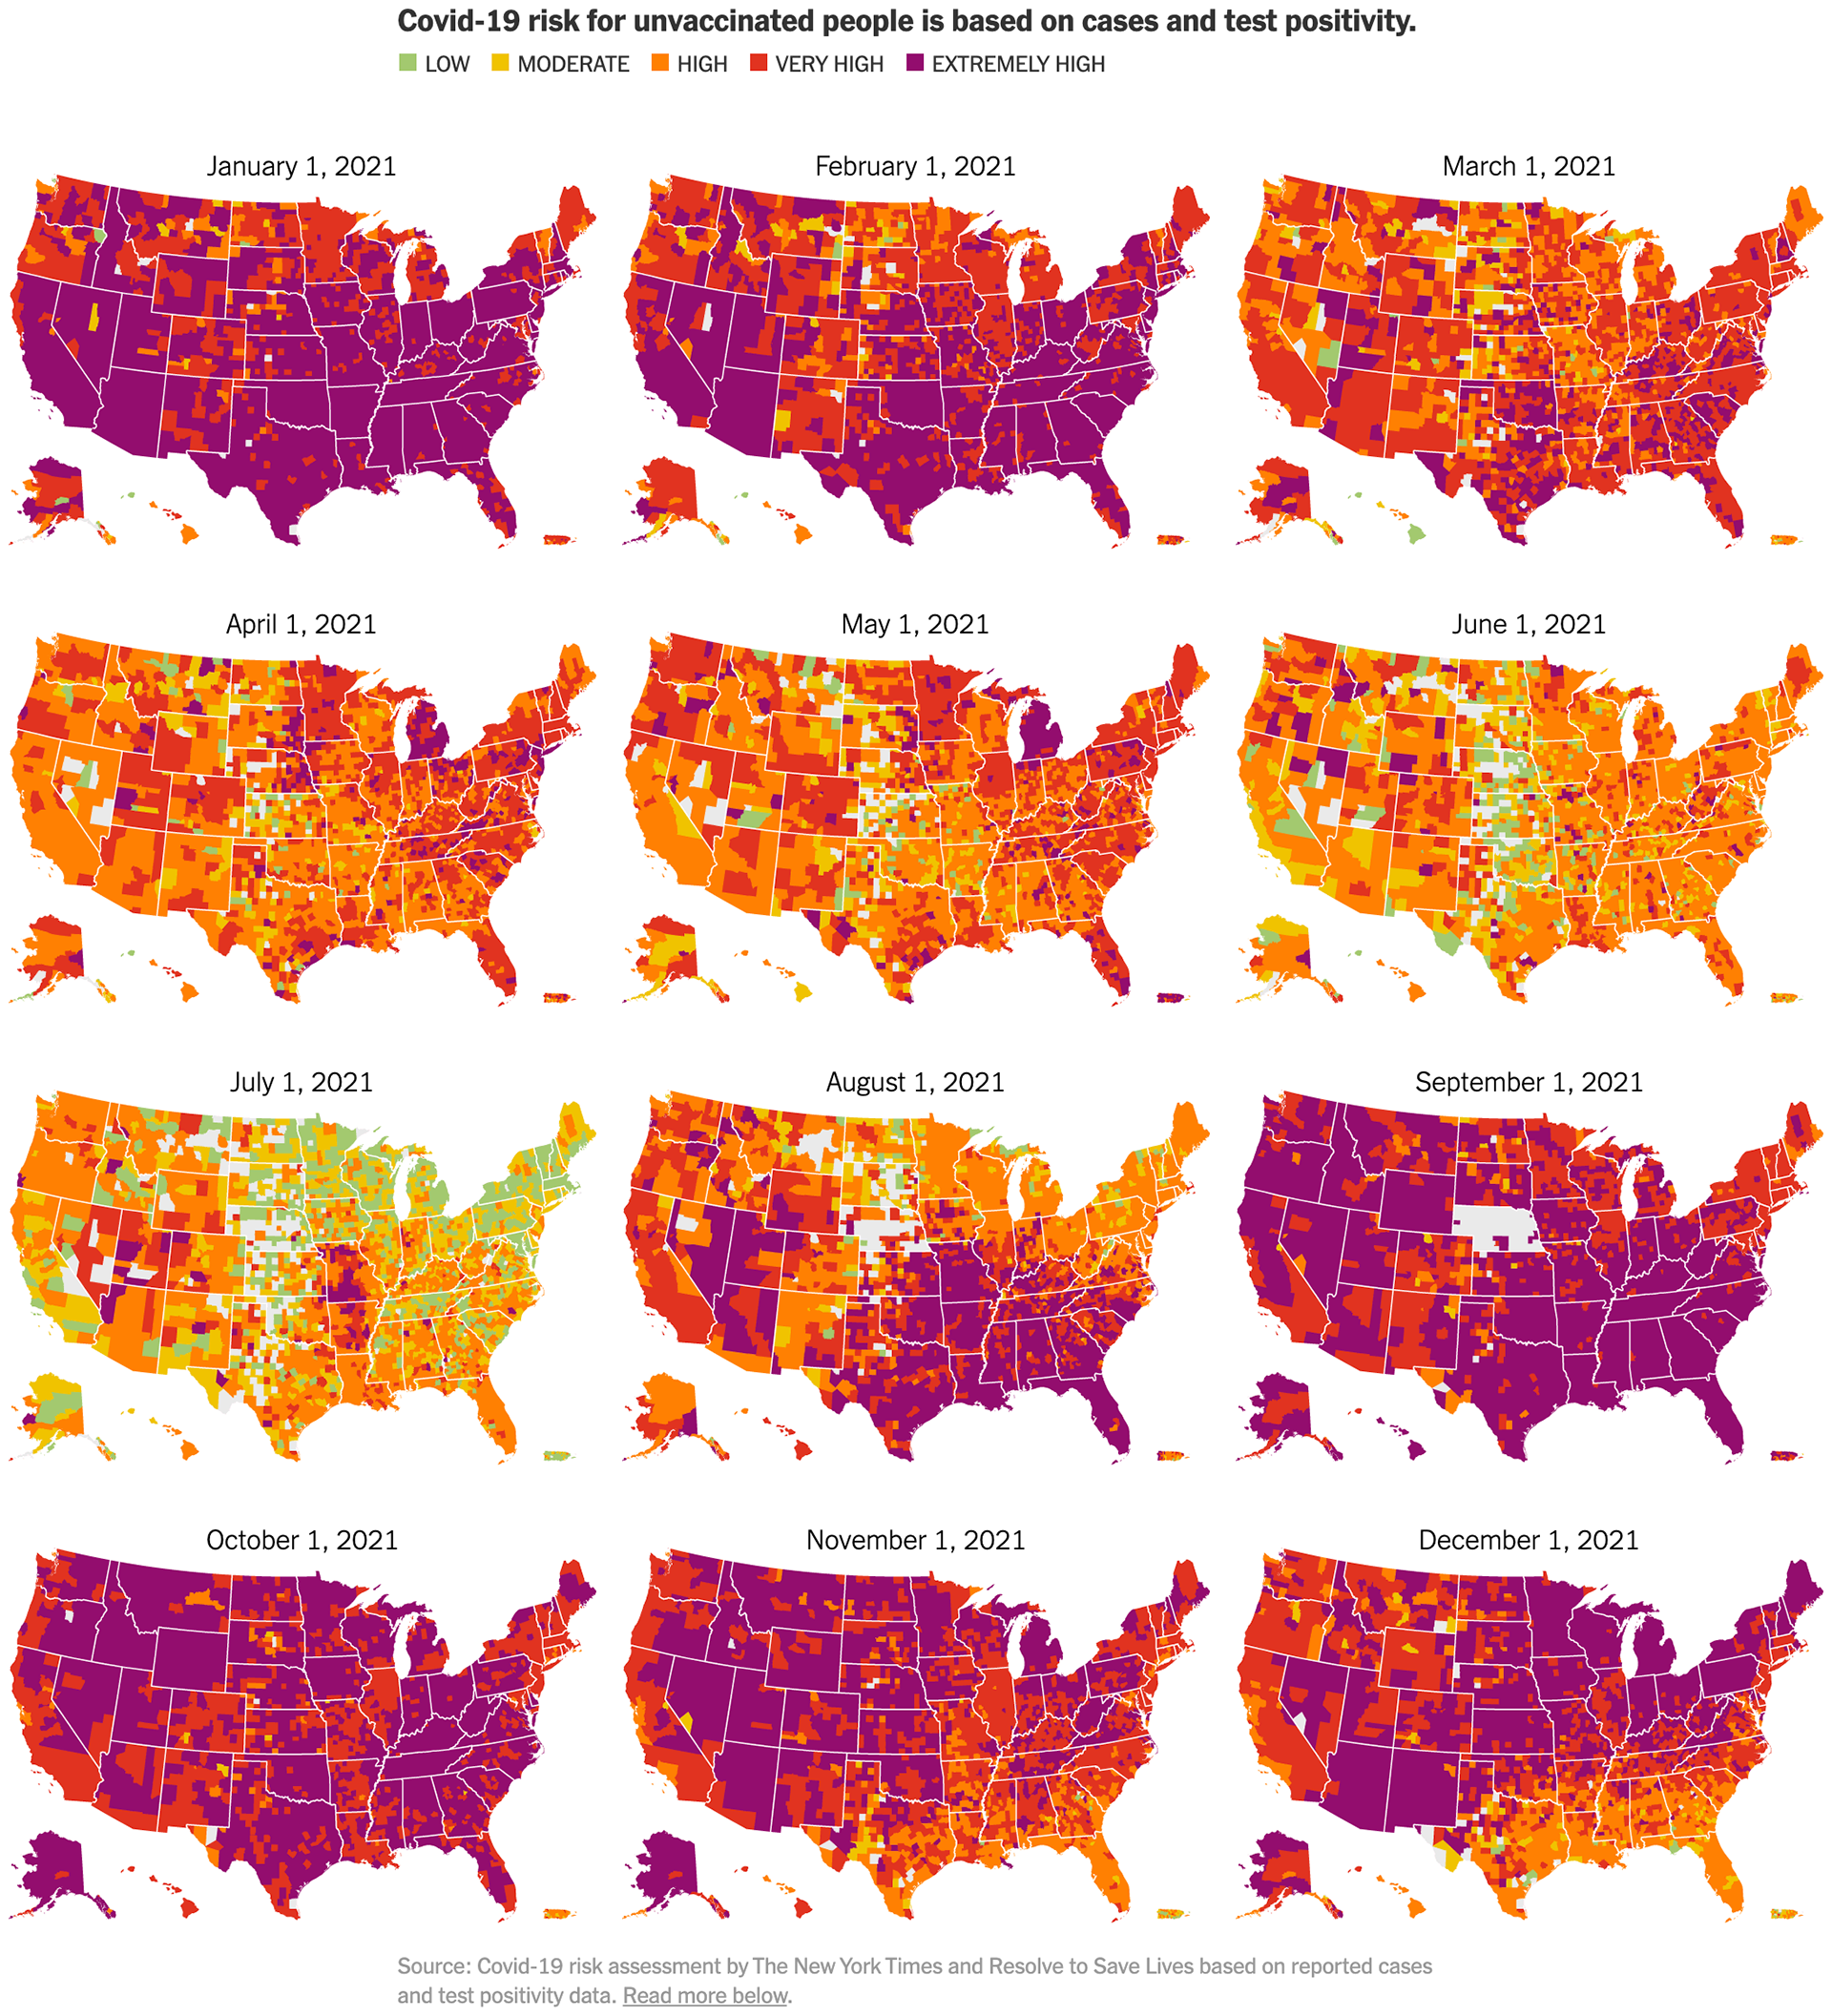
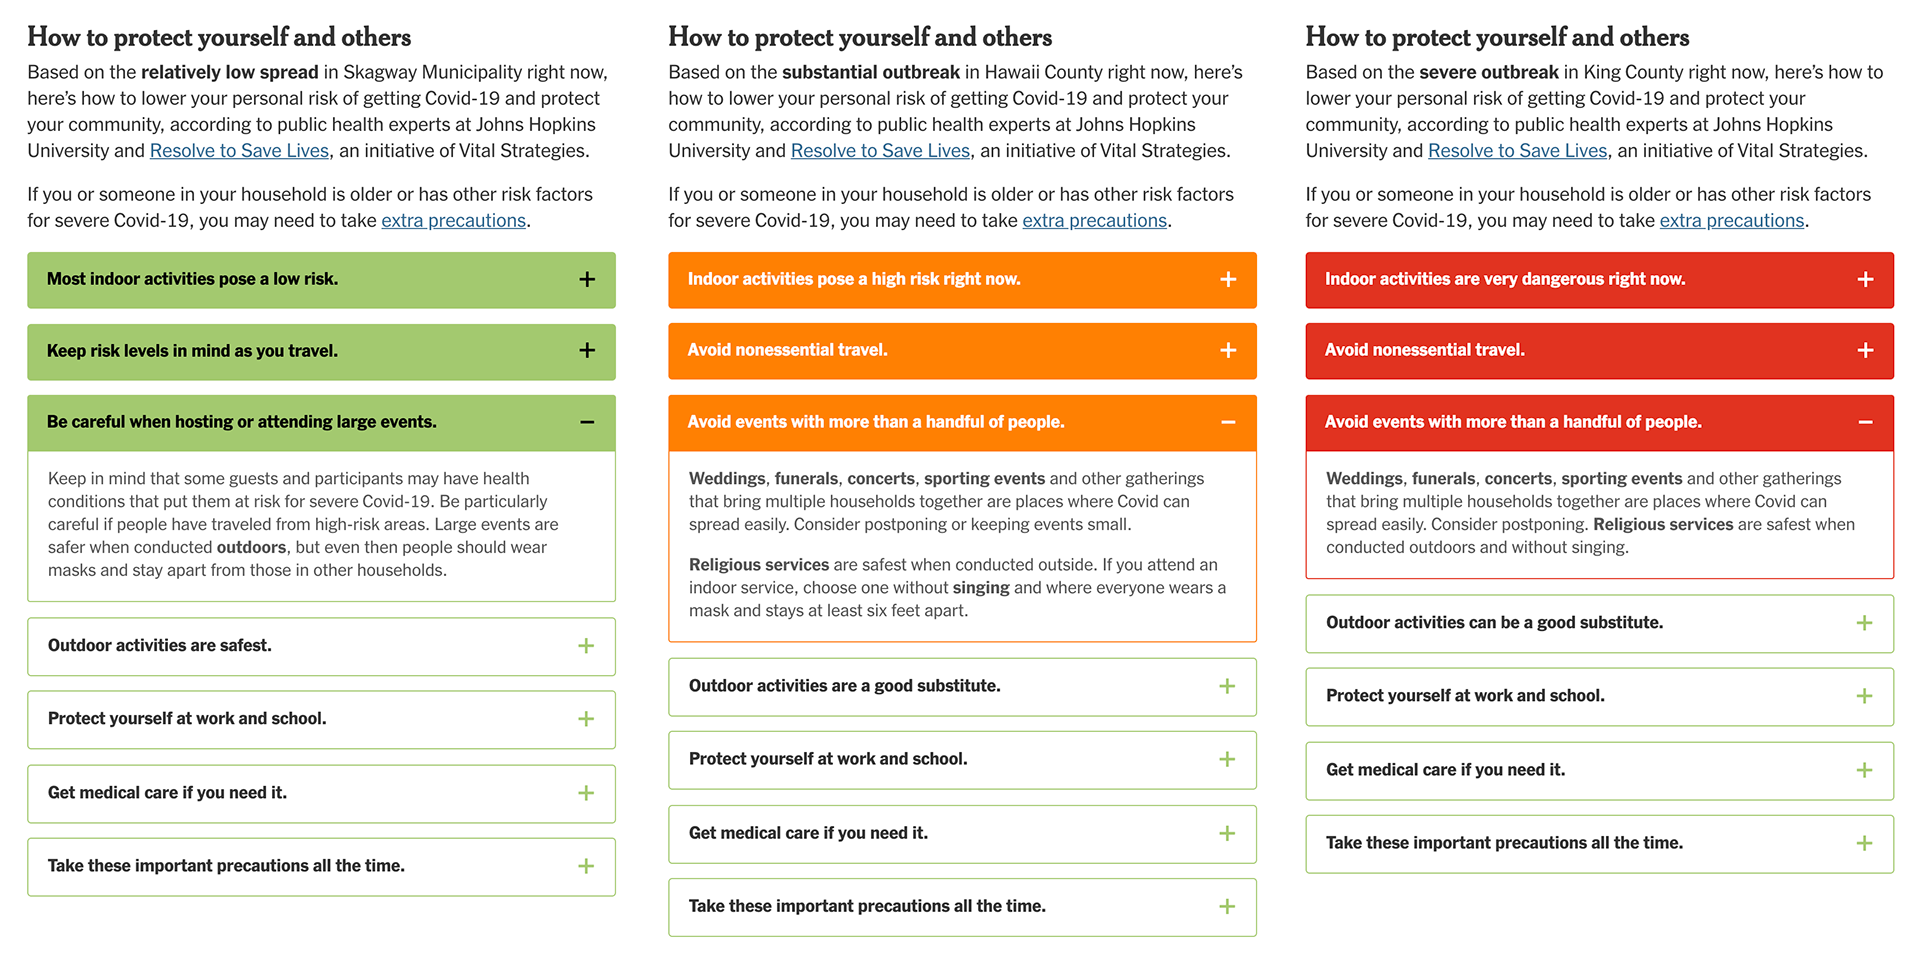
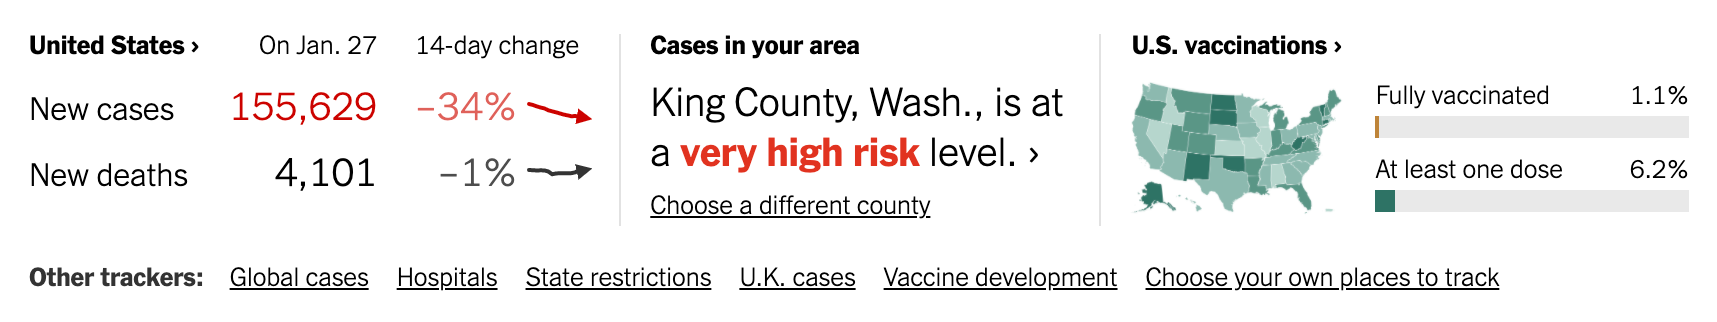
Covid-19 Risk in Your County
Throughout 2021, the Times published guidance to help readers understand their risk of catching Covid-19 in their area. At the time this resource was published, the C.D.C. did not provide this kind of localized risk-based guidance. We worked with pubic health experts to write advice for readers on how to protect themselves from Covid-19 based on the transmission rates in their area.
This project was published with Aliza Aufrichtig, Charlie Smart, Albert Sun, Rich Harris and Gabriel Gianordoli.
Tracking Dangerous Heat in the U.S.
In summer 2022, the Times published a new tracker for dangerous heat in the continental U.S. I helped produce an automatically updating graphic showing the weekly forecast that could be embedded into articles featuring news about heat waves. We also built a smaller version of the forecast that could be embedded on the Times homepage.
This project was published with Matthew Bloch, Lazaro Gamio, Zach Levitt and John-Michael Murphy.