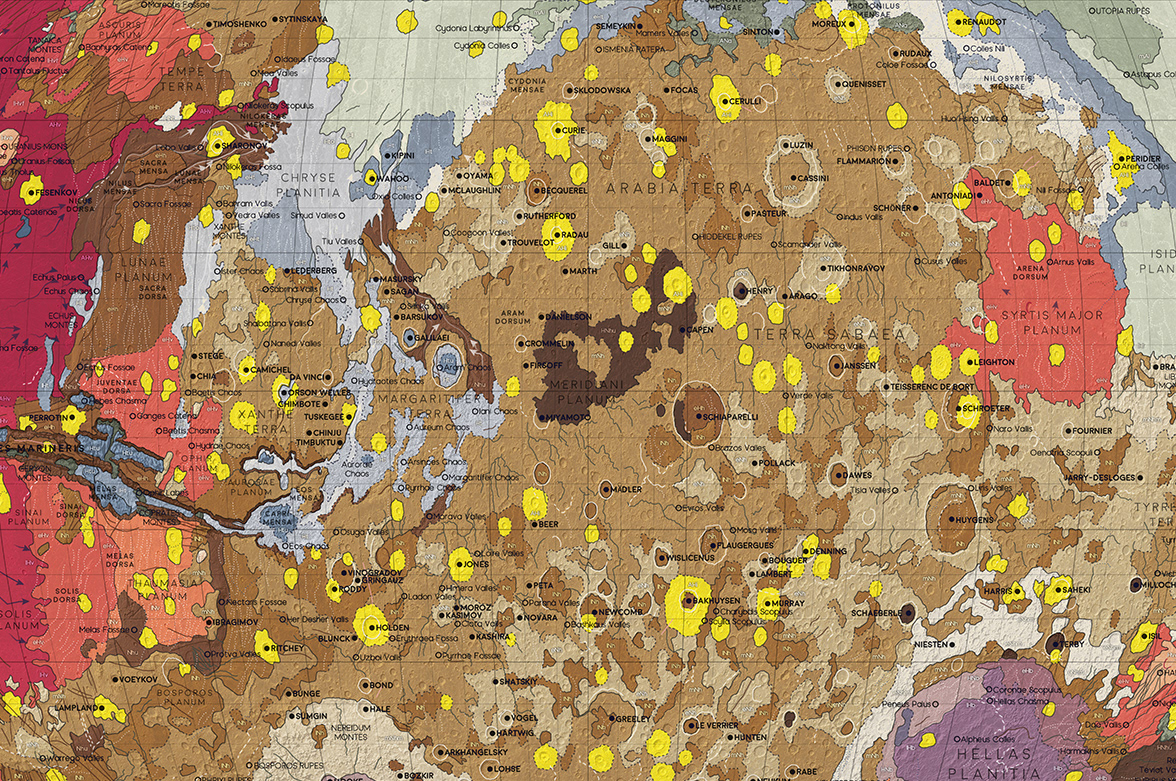
These two maps visualize the geology of Mars and the Moon using open source data from NASA and the USGS. I've open-sourced all the code in a tutorial that explains how to recreate the design for the moon map as well as the mars map. You can also buy prints or posters of the two designs here if you'd like.
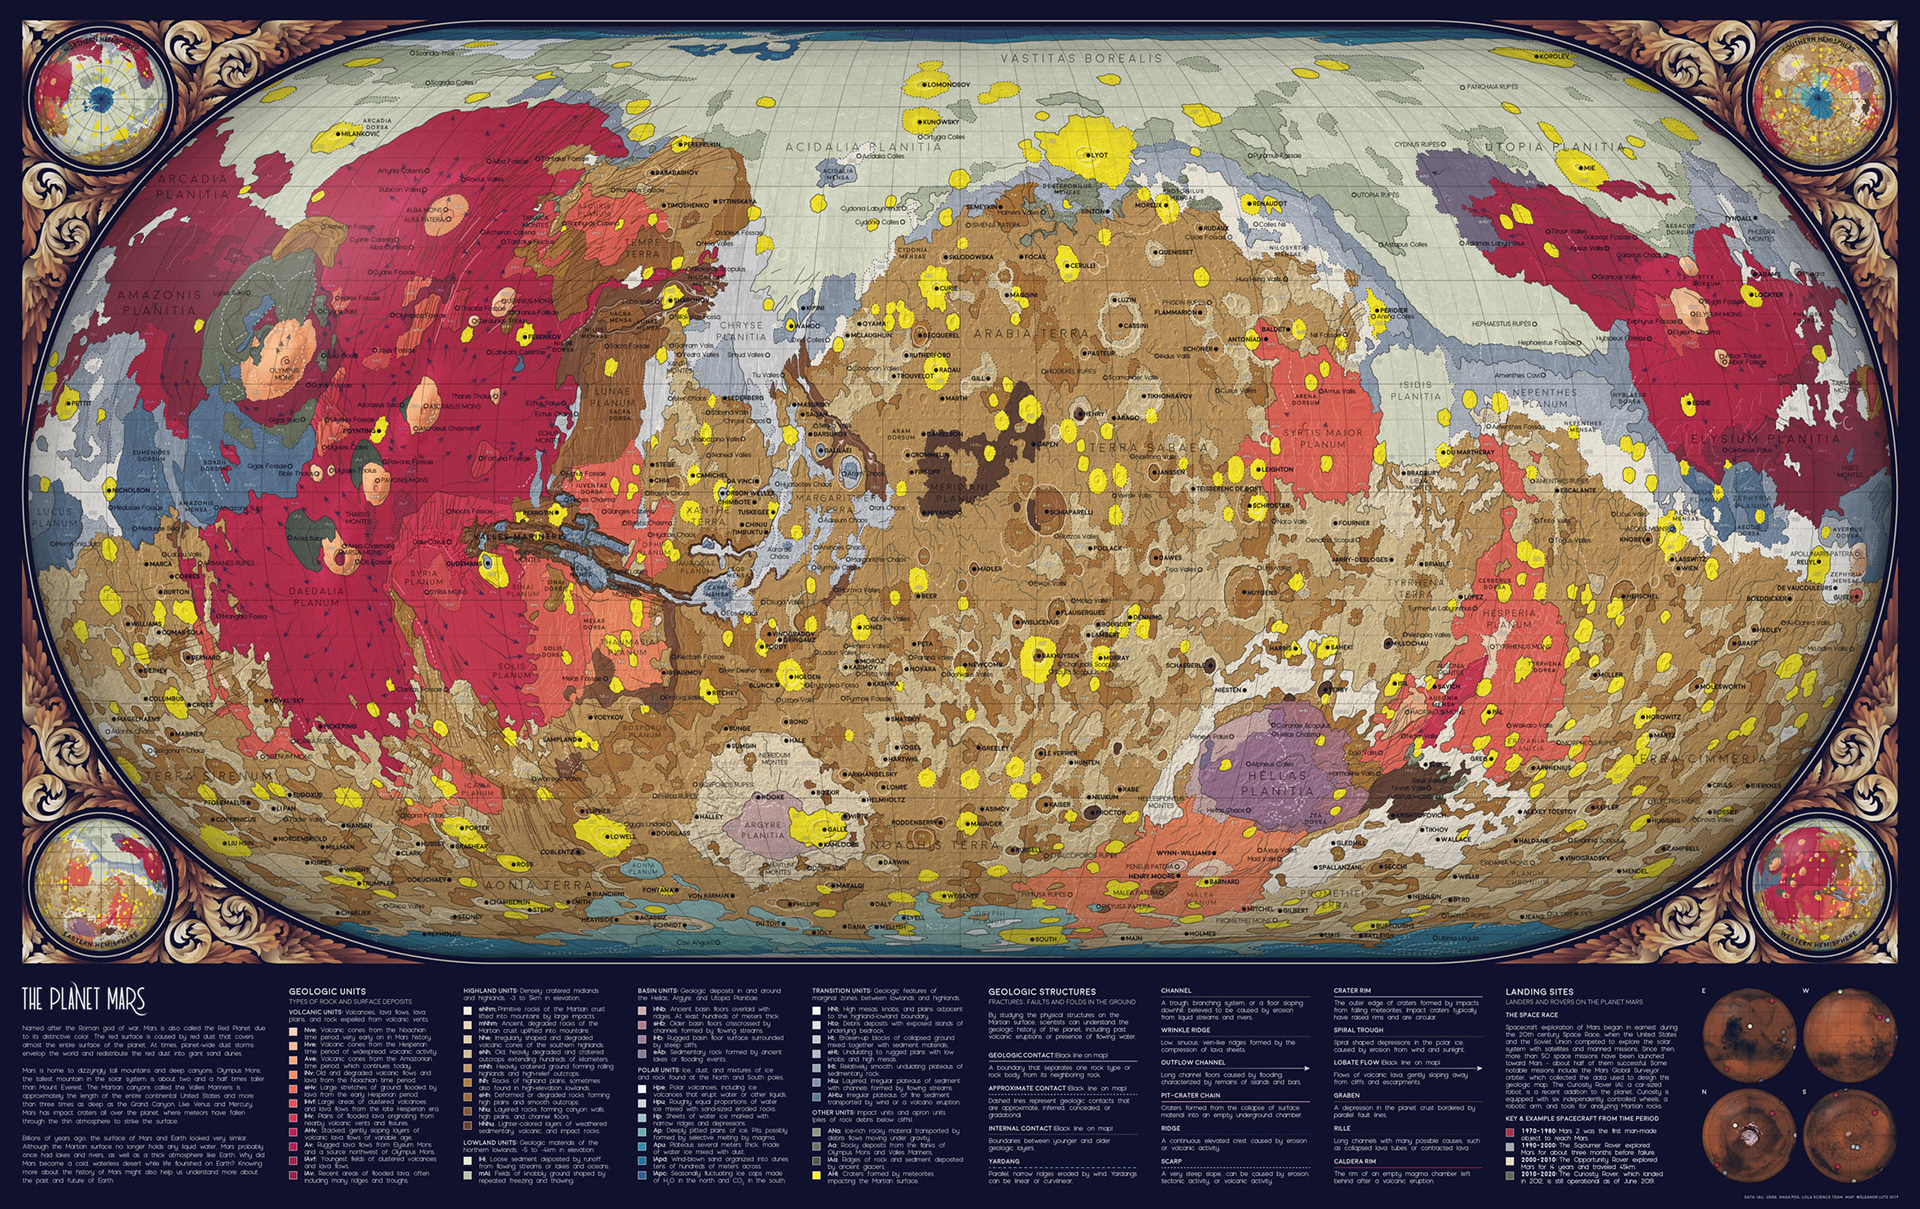
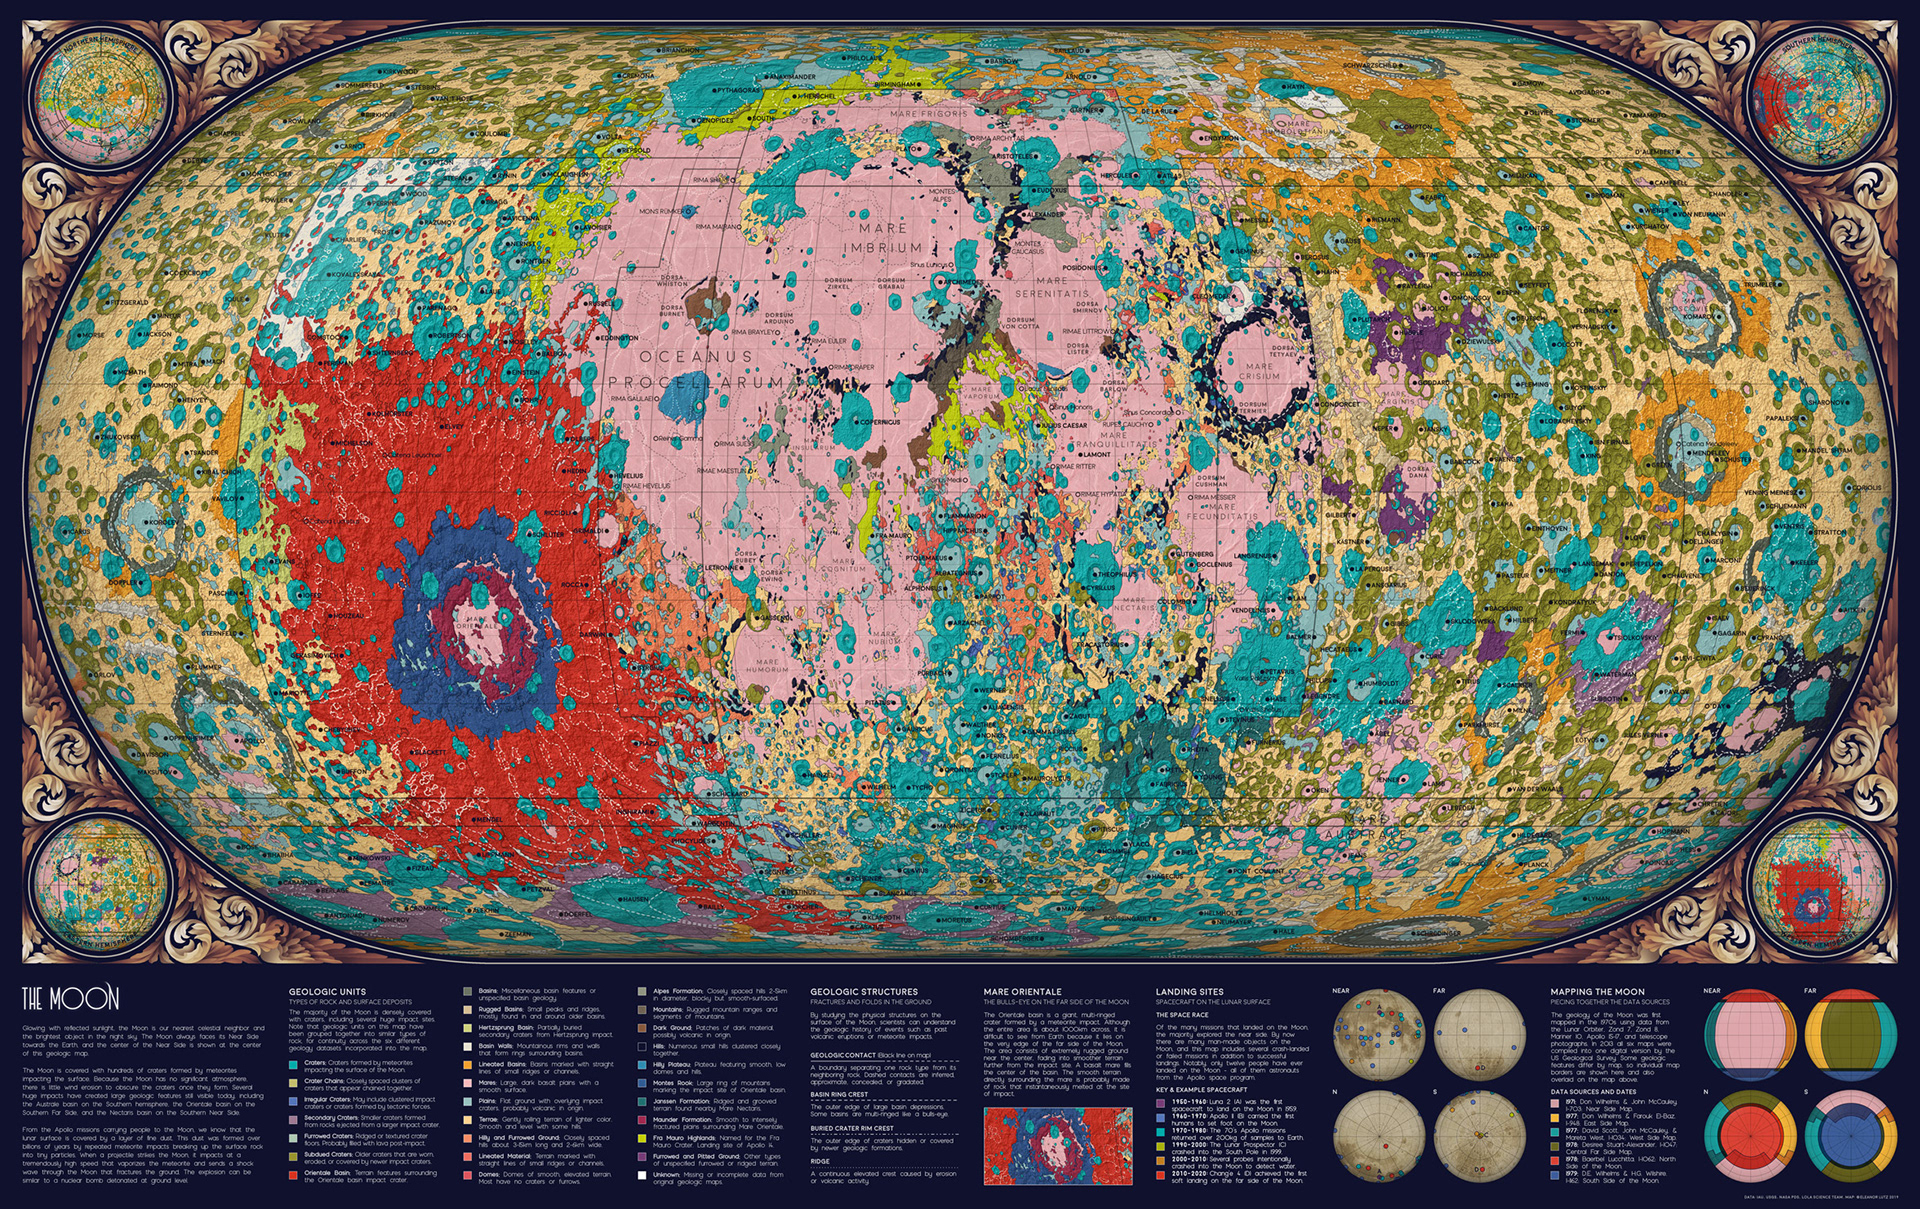
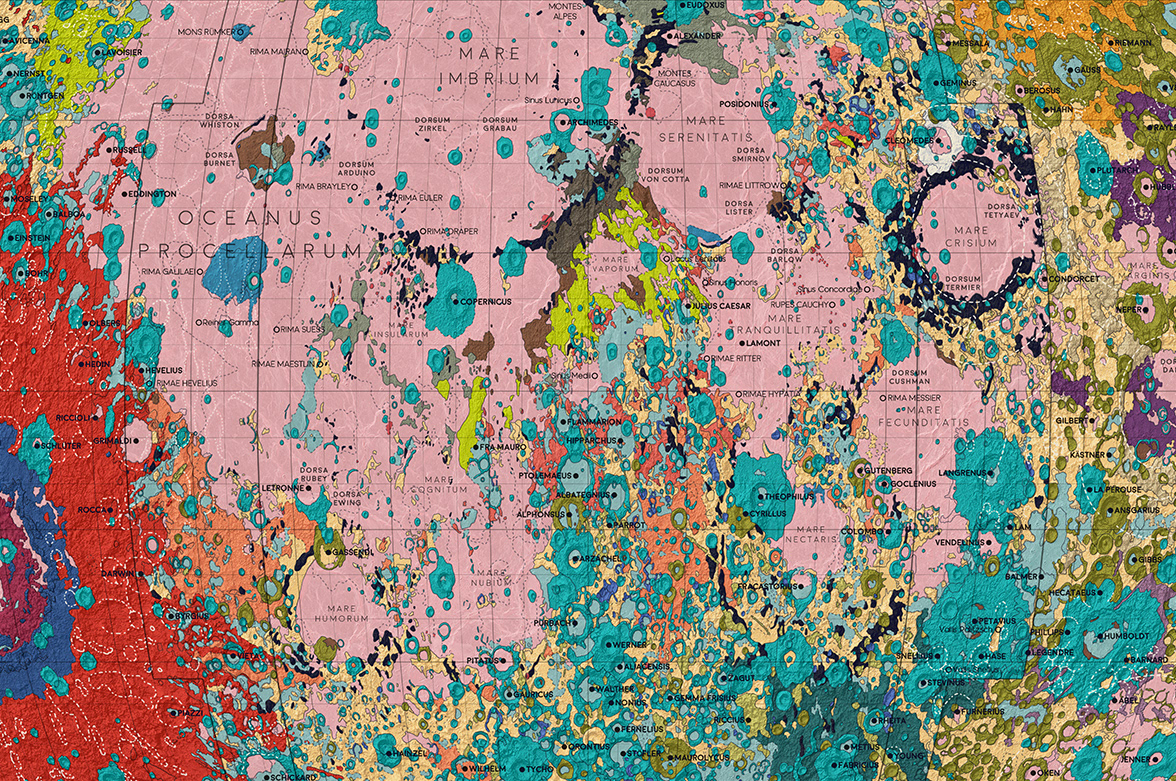
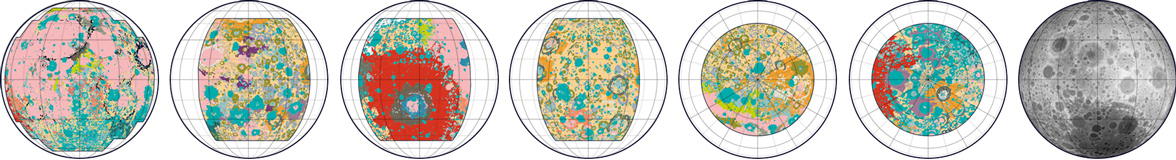
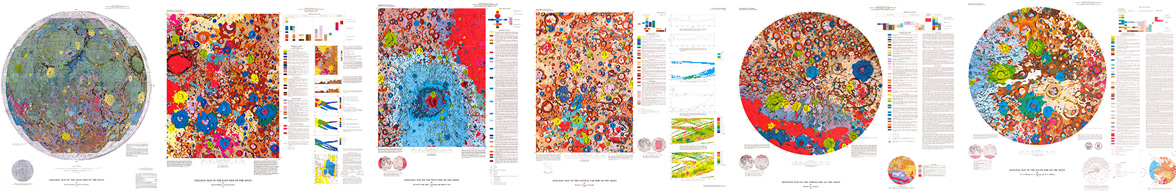
These two maps were intended for the general public, so I translated the scientific labels in the original USGS maps into more generic language. For the moon map, I also needed to merge six different geologic datasets, in addition to the Digital Elevation Model and the nomenclature labels.
The original USGS geologic maps were originally published in the 70’s, and I loved the bright neon color schemes in these historical maps. I tried to keep as many of the same colors as possible, though I re-arranged to save the more extreme colors for smaller or more unusual geologic formations.

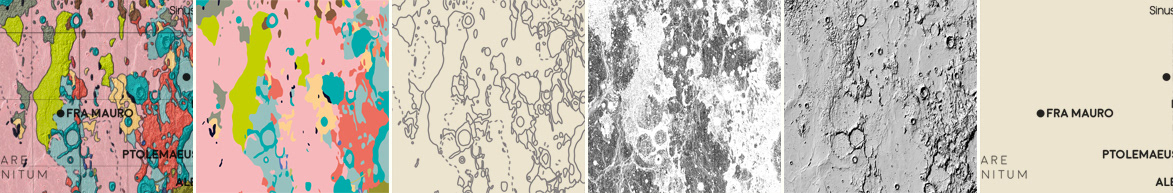
The final maps combine each of the different data layers (geologic units, geologic contacts, hillshade, slope, labels) in Photoshop and Illustrator. I used blur effects and color overlays to merge each dataset smoothly into the other layers.
These two maps are part of a larger collection of ten astronomy maps, so I incorporated the same design style I developed to tie together each map into a cohesive series.