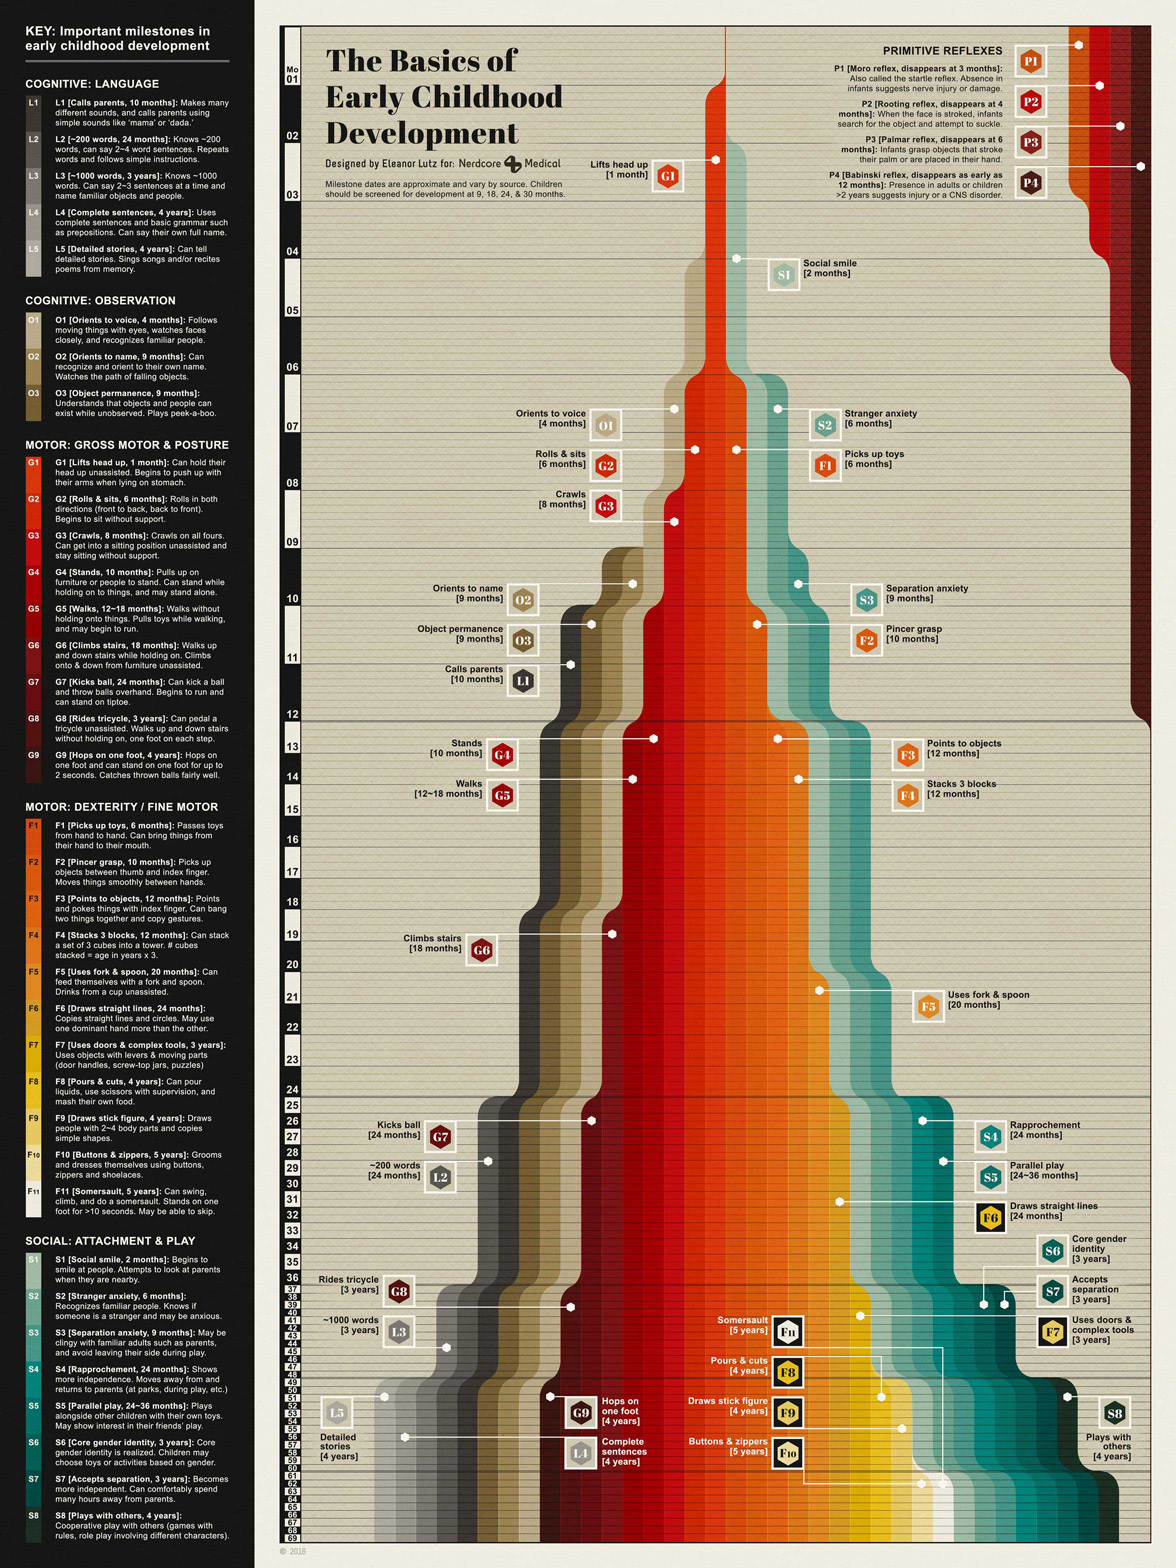
This infographic visualizes the major milestones in childhood development. It was designed as a study guide for medical students through a client project for Nerdcore Medical. A summary of each milestone is provided on the right panel of the graphic, and a more in-depth overview is included on the left panel.
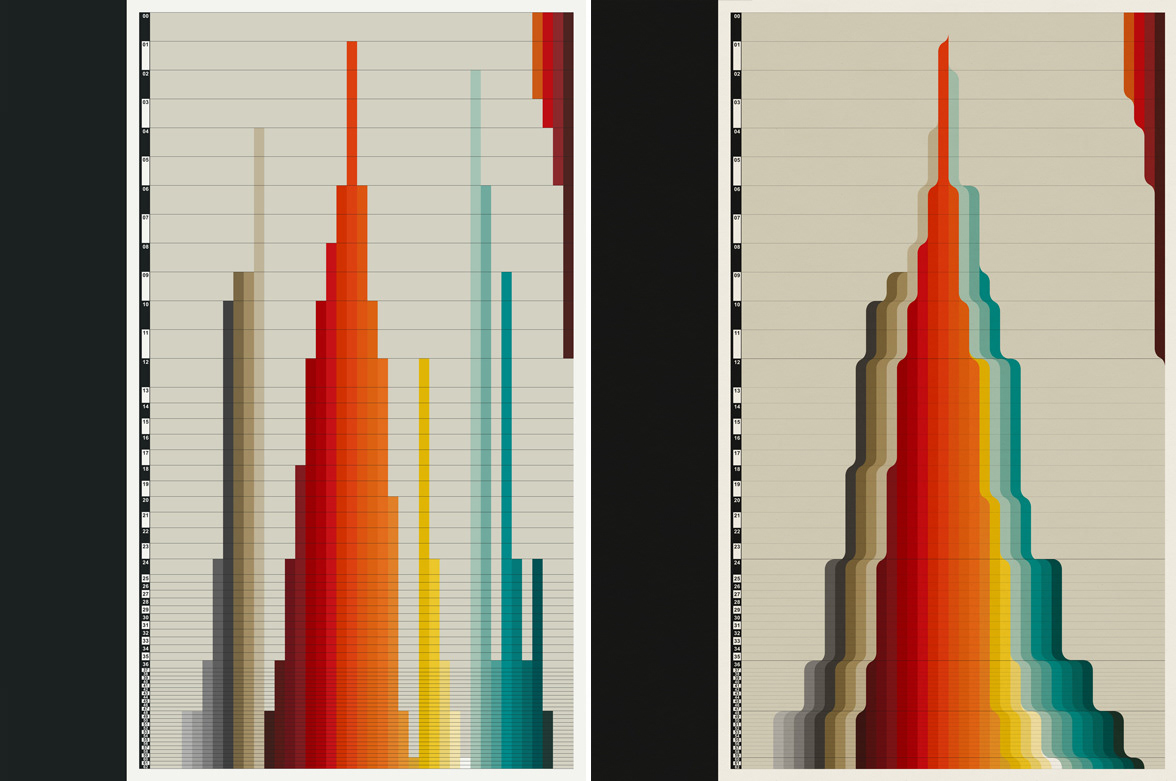
To make this design, I first organized each of the child-development milestones by category (social milestones, language milestones, etc.) and picked a gradient of colors for each group. Then I made a custom timeline that separated milestones legibly by compressing time near the bottom of the diagram.
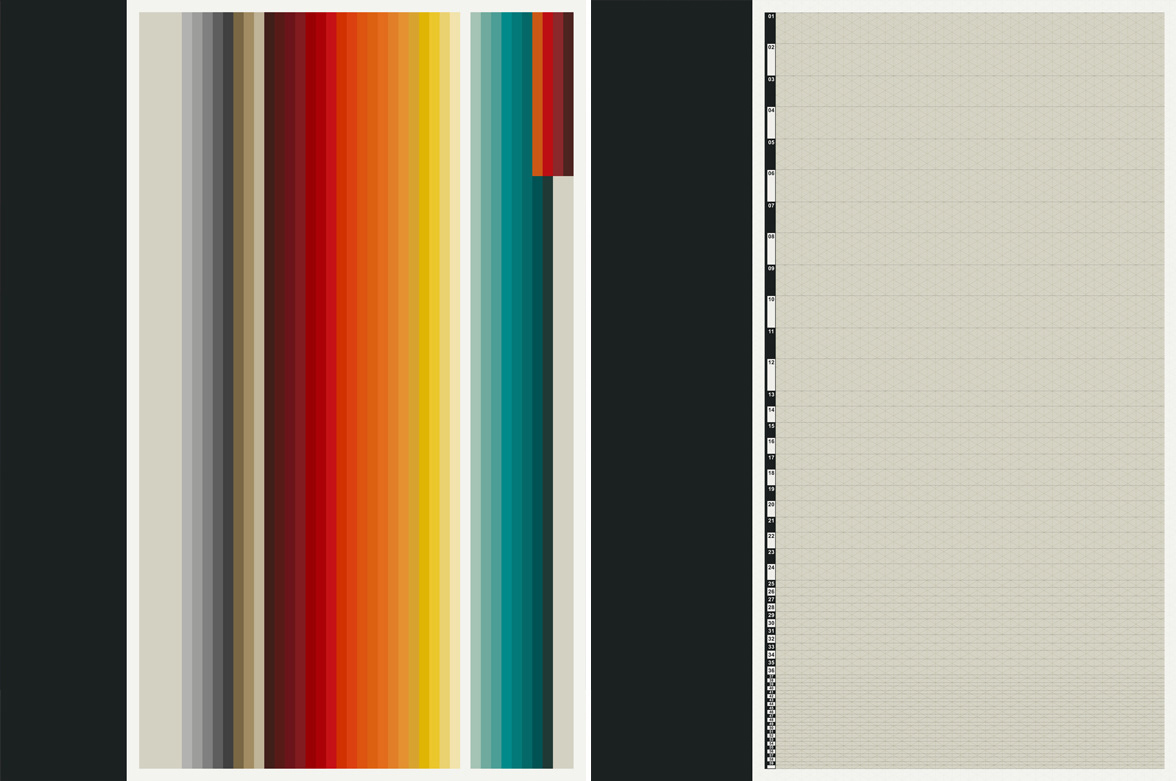
I next clipped each timeline column to the correct age length. Since a lot development milestones depend on earlier skills, I also decided to stack each skill onto all of the previous ones so that the entire design looked like a waterfall. Finally I edited the top border of each column to curve and flow organically.